Stop debugging background job failures in the dark.
SpanHQ gives you full execution traces for every BullMQ job — every retry, every child job, every failure — with one npm install.
When HTTP requests fail, you have traces.
When background jobs fail, you have nothing.
- No context about parent jobs
- Can't see downstream impact
- Retry history lost on completion
- Silent failures for hours
- See full job execution chain instantly
- Every retry logged with exact error
- Know exactly what was skipped downstream
- Find root cause in seconds
One npm install. Two lines of code.
Works with your existing BullMQ code. No migration. No YAML. No infra changes.
That's it. No config files. No YAML. No changes to your existing job handlers.
Everything you need to understand your jobs
Full Execution Trace Tree
See every parent-child job relationship visually. Know instantly which job triggered which, even across async boundaries.
Complete Retry History
Every attempt logged with exact timing and error. Never wonder which retry introduced the bug again.
AI Failure Diagnosis
When a job dies, AI analyzes the stack trace and tells you the root cause and exact fix. No more guessing.
Instant Dead Job Alerts
Get Slack and email alerts the moment a job exhausts all retries. Not when a customer complains — immediately.
Works With Existing Code
No changes to your job handlers. Wrap your existing Worker and Queue. Every job automatically traced.
Built for BullMQ
Not a generic tool repurposed for queues. Built from the ground up for BullMQ's event system, retry mechanics, and job lifecycle.
Real developers. Real frustrations. We didn't invent this problem — Reddit did.
These are real comments from r/node. This is the pain SpanHQ was built to solve.
How do you debug BullMQ job failures in production?
I've been struggling with background jobs failing silently and spent hours digging through logs last week to find a simple retry issue. Curious how others handle this — do you have any tools or techniques that actually work?
The biggest thing that helped me was making failures impossible to ignore. With BullMQ I usually add a global failed handler and push errors to logs or alerts immediately. Also make sure retries and backoff are visible, because silent retries can hide the real issue for a long time.
This is exactly the pain I'm solving. I'm building a tool that makes the full job tree visible — every retry, every child job, exactly what failed and when.
Telemetry. Every consumer emits a canonical log and trace. OpenTelemetry will help pinpoint errors.
OpenTelemetry is powerful but the setup for BullMQ specifically is brutal. I'm building something that works out of the box for BullMQ with zero manual instrumentation.
BullMQ's failed event combined with a dead letter queue pattern saved me a lot of pain. I log the job name, id, data, and error to a table on every failure. Also worth setting up Bull Board so you can see stuck and failed jobs at a glance.
That means we have to set up the dashboard manually every time for different projects, right? That's what SpanHQ eliminates.
Silent failures in background jobs are the worst. Having proper retries + alerting makes a huge difference. Also adding structured logging around job start/fail helps a lot when debugging. Without visibility, you're basically guessing every time.
This is what SpanHQ looks like
Not mockups. Not wireframes. Real product screenshots.
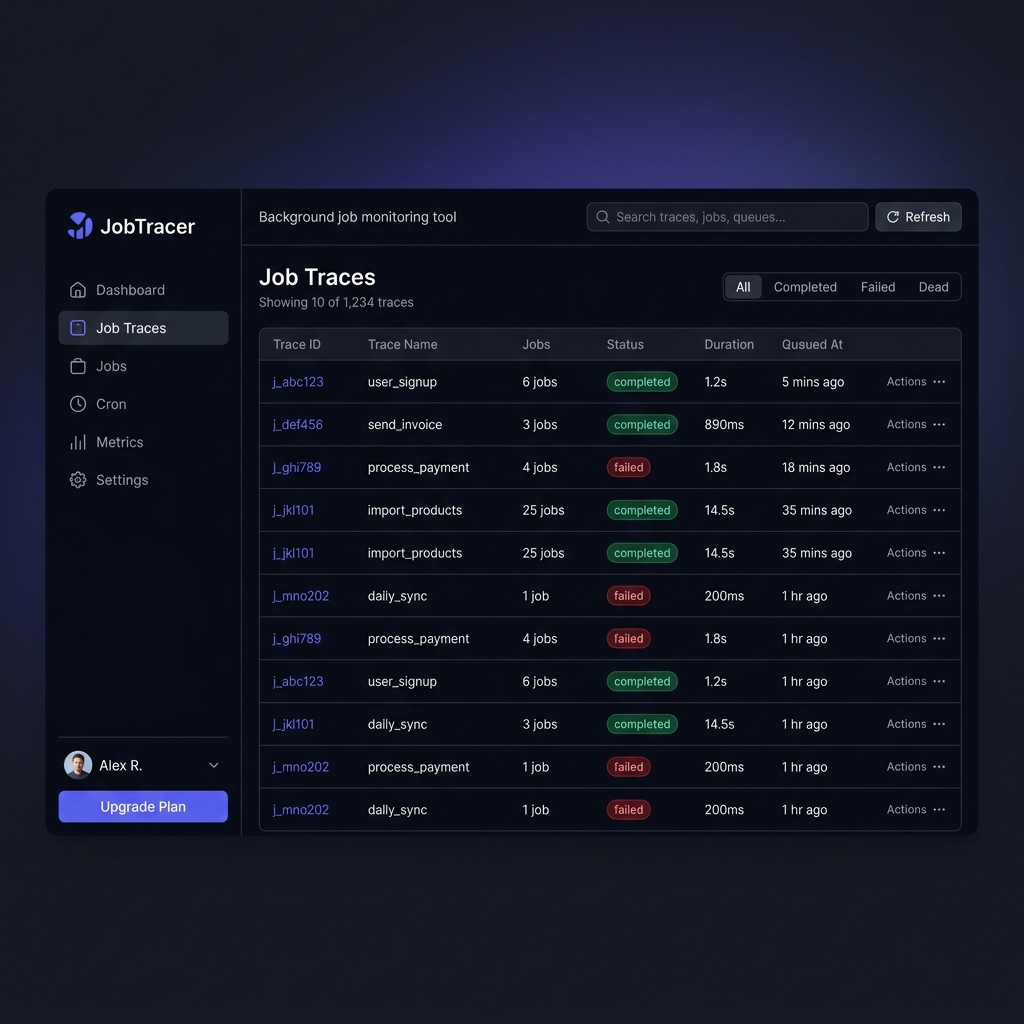
Trace List View
See every trace at a glance — name, status, duration, and job count. Filter by completed, failed, or dead.
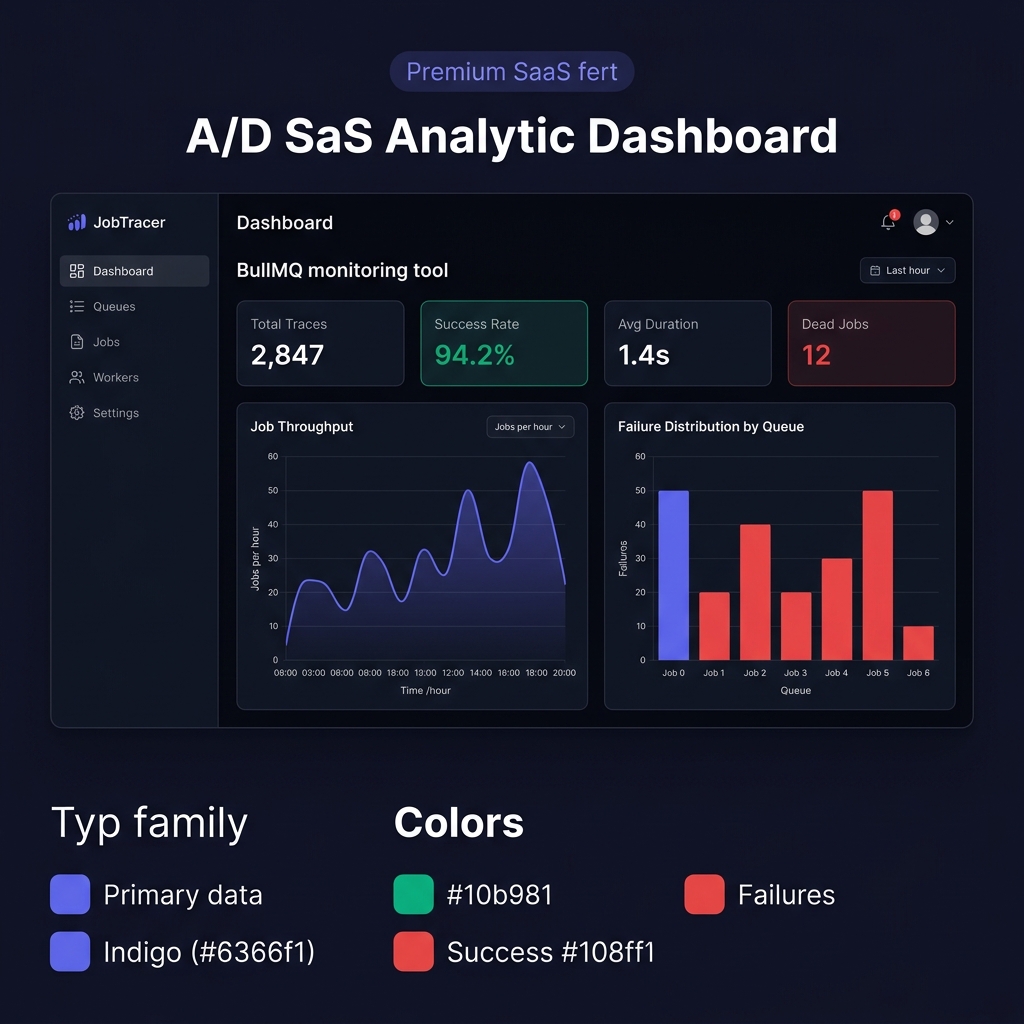
Analytics Dashboard
Real-time stats: total traces, success rate, avg duration, and dead job count with throughput and failure charts.
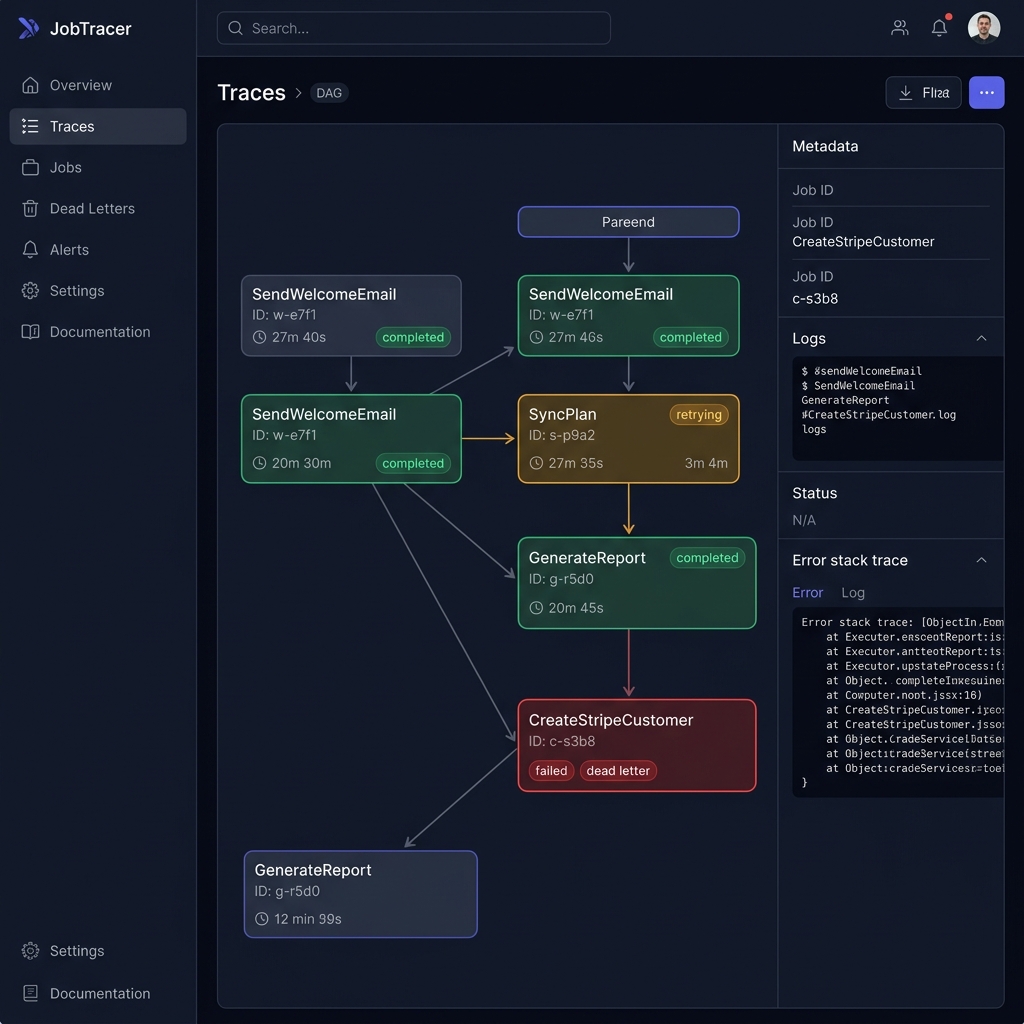
Trace DAG Visualizer
See the full execution tree — every parent, child, retry, and failure across your entire job chain. Click any node to see logs, metadata, and stack traces.
Be first to know when we launch.
Join the waitlist. No spam. One email when we're ready.